Data-Driven Financial Clarity
Transform complex operational data into actionable insights. Monitor trends, manage fixed costs, and optimize your net profit with precision.
Operational Trends
Revenue Streams & Growth
Visualize your daily operational revenue alongside profit margins. Identify key performance indicators and channel contributions at a glance.
-
analytics
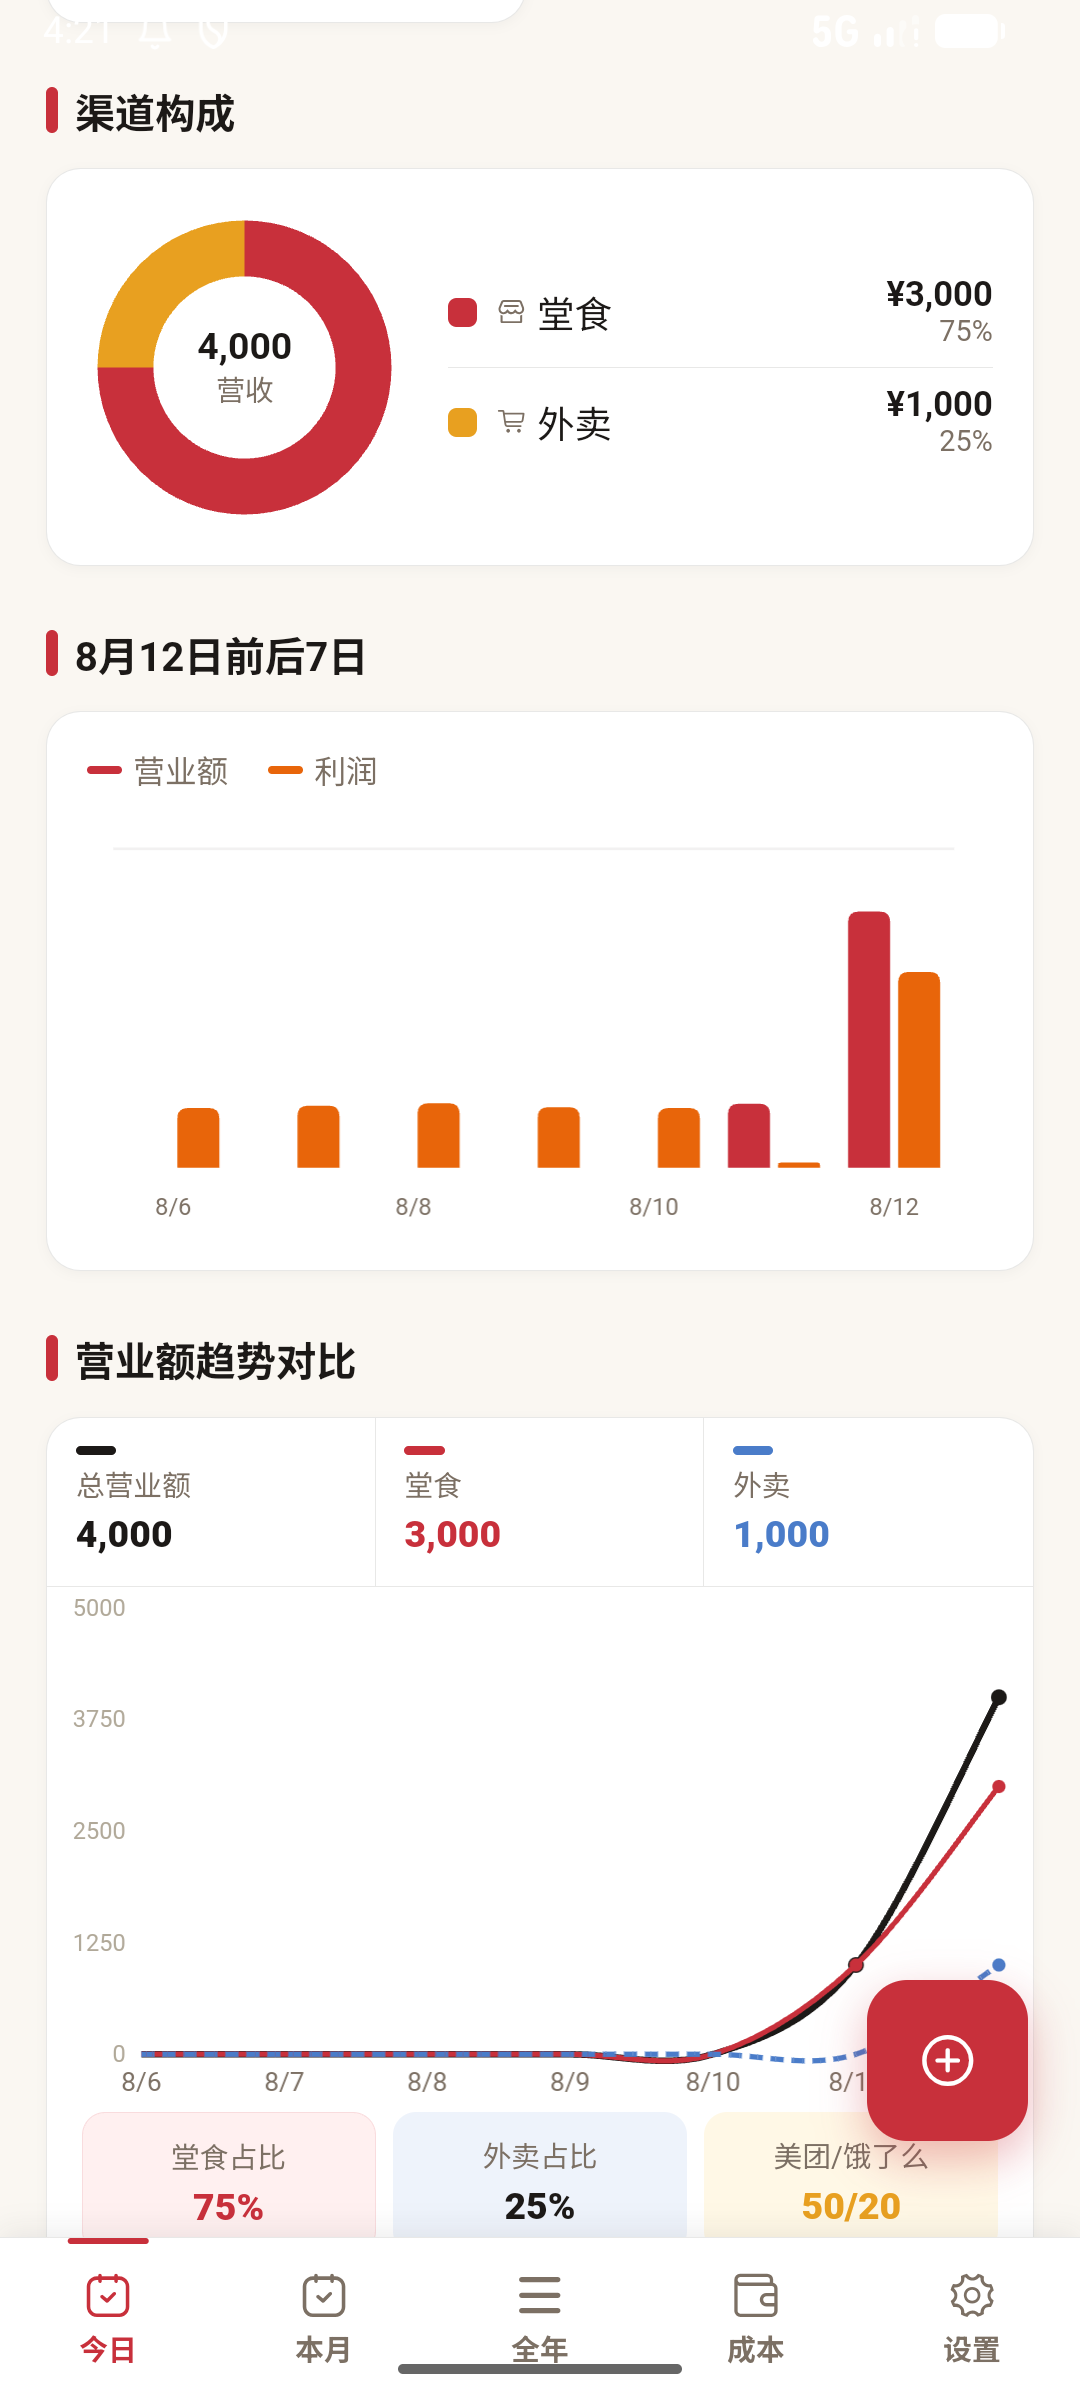
Channel Breakdown
Track dine-in vs. delivery performance.
-
trending_up
7-Day Trajectory
Monitor short-term revenue fluctuations.
Intelligent Cost Management
storefront
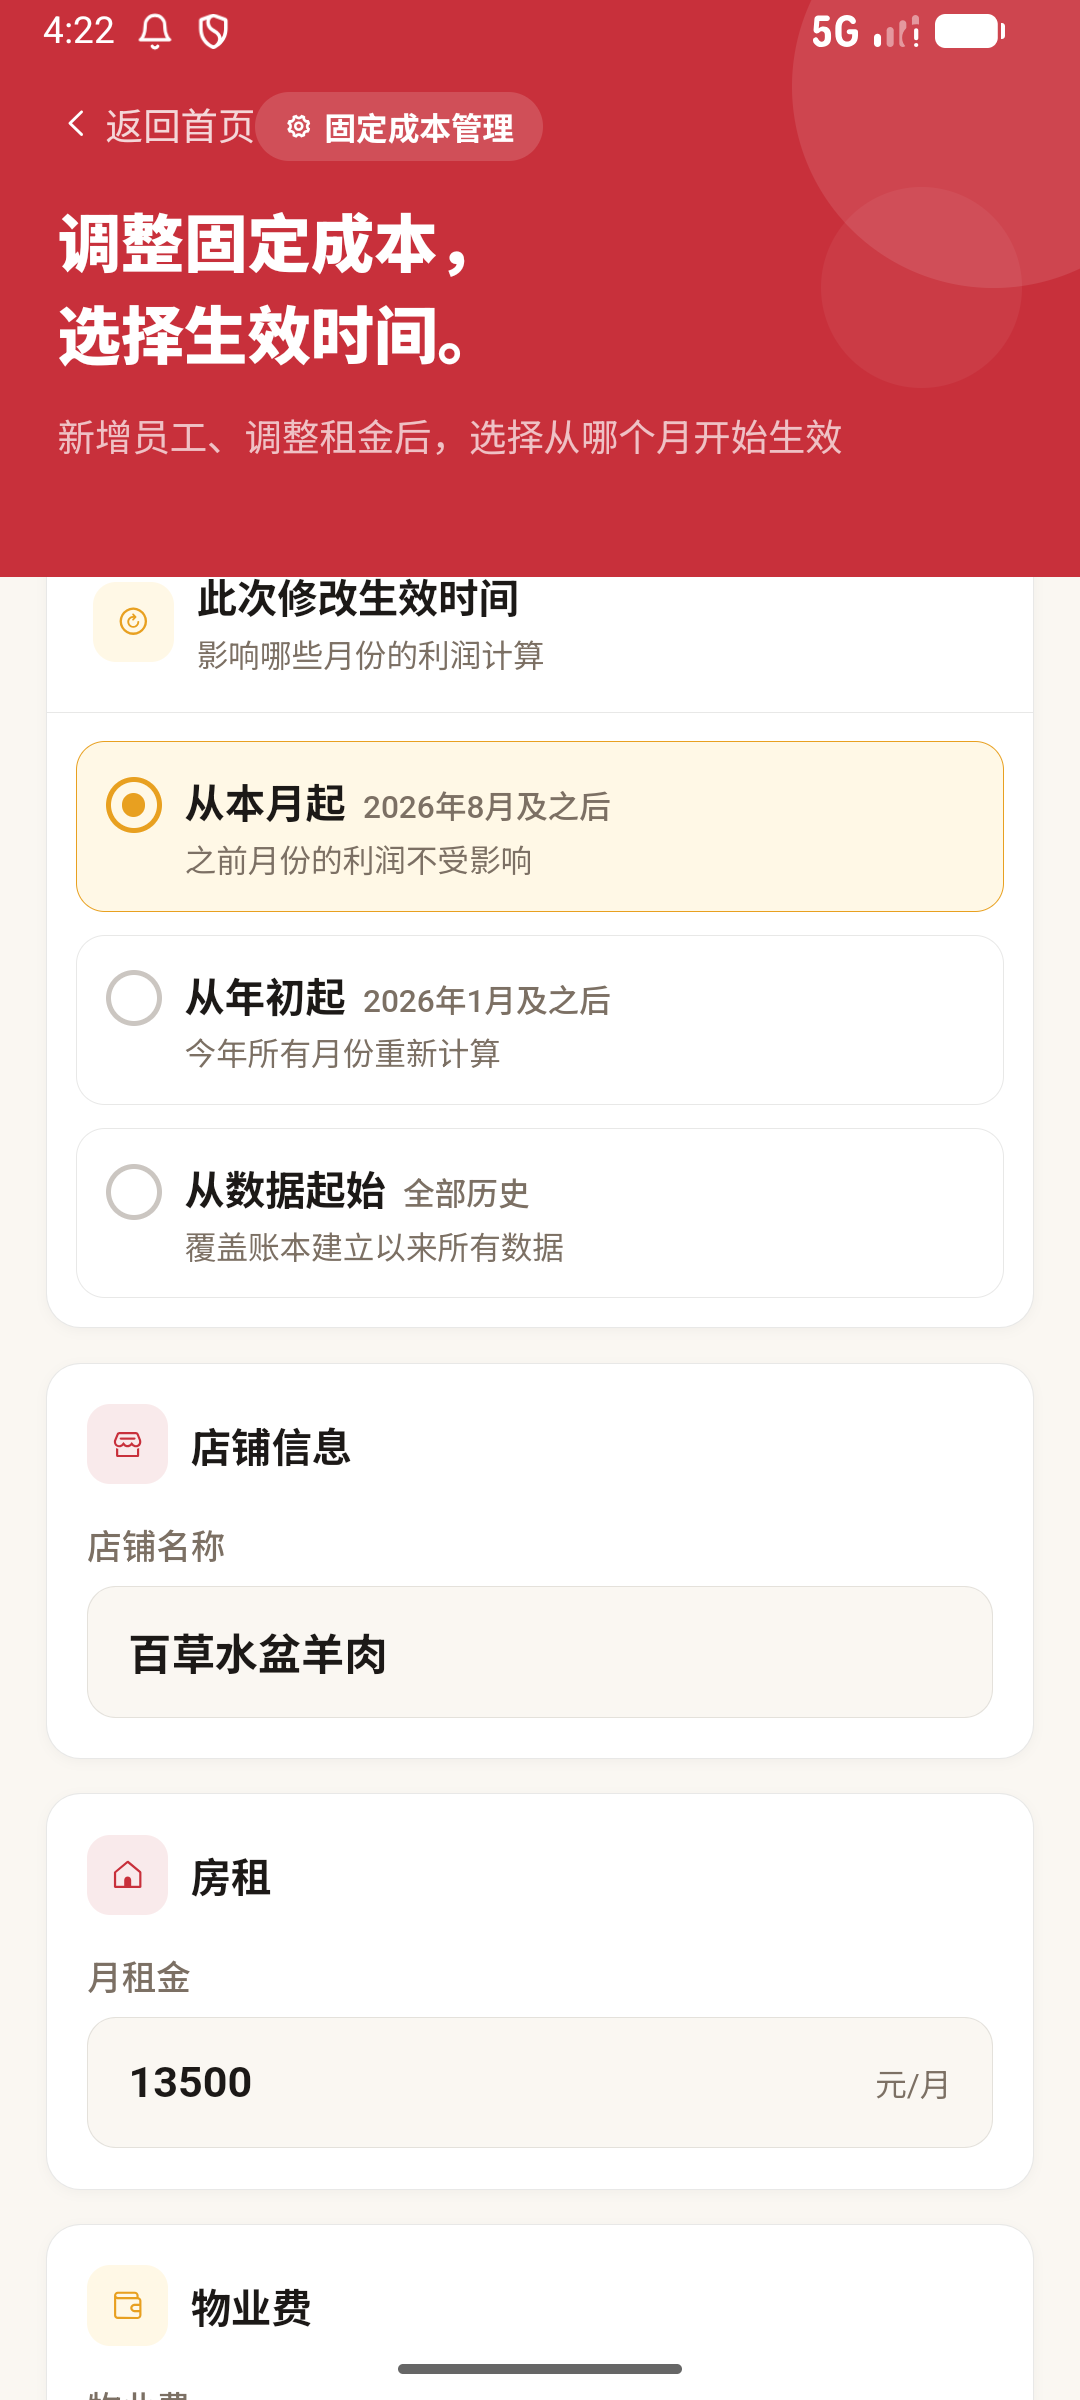
Store Information
Baicao Mutton Soup
payments
¥/Month
Monthly Rent
13,500
percent
Gross Margin Target
40
%
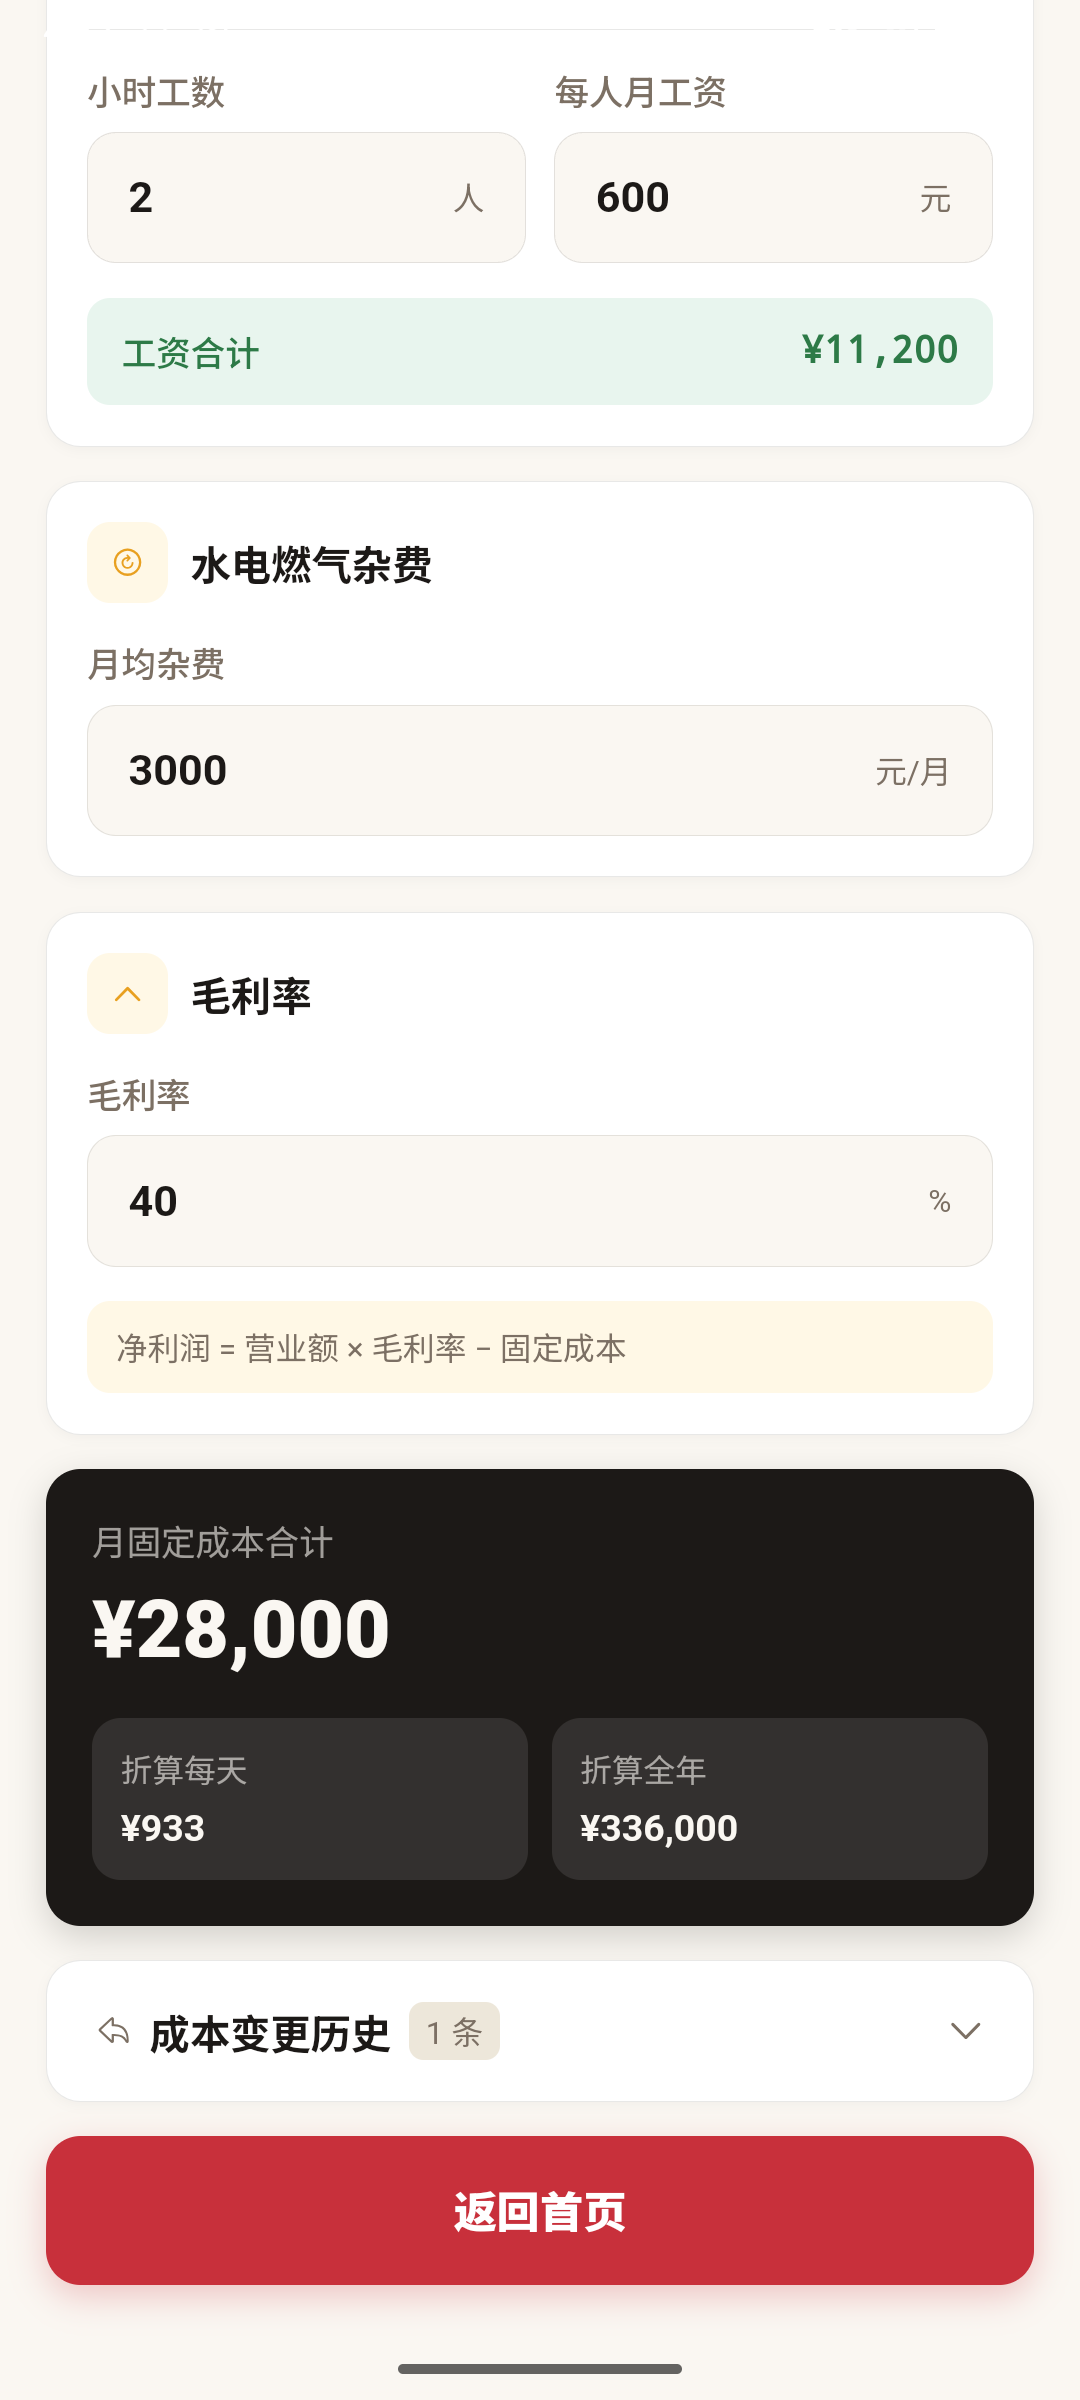
Net Profit = Revenue × Gross Margin - Fixed Costs
Total Monthly Fixed Costs
¥28,000
Daily Equivalent
¥933
Annual Projected
¥336,000